Quick answer: To explore electric vehicle charging emissions by U.S. ZIP code, use the U.S. EPA Power Profiler to look up the regional electricity profile associated with an address. Combine the relevant emissions factor with the kilowatt-hours used for charging to create a simplified electricity-generation estimate. A ZIP code alone cannot tell you your exact carbon footprint or whether an EV is cleaner in every individual circumstance.
Why EV charging emissions depend on location
A battery electric car produces no tailpipe emissions while driving. However, power stations supplying electricity may emit carbon dioxide and other pollutants. The generation mix varies by region and changes over time. Solar, wind, hydroelectric, nuclear, natural gas and coal have different direct operating characteristics and lifecycle impacts. That is why an EV charged in one area can have different electricity-related emissions from an identical EV charged elsewhere.
How to check your electricity region with EPA Power Profiler
- Open the official EPA Power Profiler webpage.
- Use its current ZIP-code lookup, if available in the EPA interface, to identify the associated electricity region.
- Read the electricity generation mix and emissions rates alongside their dataset year and units.
- Do not treat regional figures as a live reading of your home’s power or as the exact rate of every charging hour.
- Keep a note of the source year, region and metric before comparing it with another area or another report.
How to estimate electricity-related charging emissions
The basic calculation is charging energy used (kWh) × electricity emissions factor (kg CO₂ per kWh) = estimated electricity-related CO₂ (kg). Example: if a hypothetical session consumes 30 kWh from the wall and a hypothetical regional factor is 0.35 kg CO₂/kWh, the arithmetic is 30 × 0.35 = 10.5 kg CO₂. The 0.35 figure is an illustrative assumption, not the confirmed EPA rate for any ZIP code.
Use the electricity from the meter or charger rather than only the battery’s displayed energy increase when possible: some incoming electricity is lost during charging. For more on the distinction, read our EV charging losses explainer.
Average emissions vs time-of-use emissions
Power Profiler helps explain broad regional patterns, not second-by-second marginal emissions. The grid mix can differ between night and daytime, and additional electricity demand can be supplied by generation sources that differ from the annual average. An annual regional factor is useful for an approximate comparison but should never be represented as an exact real-time measurement.
What about solar charging?
A solar canopy or rooftop solar system can supply some charging energy when sufficient sunlight and system capacity are available. Yet whether a specific EV charge uses on-site solar power, stored energy or grid power depends on the electrical arrangement and timing. Photovoltaic equipment also has manufacturing-related lifecycle impacts, so calling all solar charging literally zero-emission is inaccurate.
Electricity emissions are not full lifecycle emissions
The estimate above covers an electricity-generation accounting boundary. It does not include vehicle and battery manufacture, extraction and processing of materials, charging-station construction, grid infrastructure, or all upstream fuel emissions. For a broader comparison with gasoline vehicles, see our EV vs gasoline lifecycle emissions article and EPA’s electric vehicle myths and facts. Comparing only tailpipes against power-plant emissions would use inconsistent system boundaries.
Checklist before reporting an EV carbon number
- State whether the estimate is per charging session, mile, kWh or year.
- Give the measured or assumed electricity consumption.
- Cite the exact regional emissions rate, units and publication year.
- Differentiate regional averages from time-sensitive marginal values.
- Distinguish electric-grid emissions from full vehicle lifecycle emissions.
- Never describe illustrative values as measured local outcomes.
Official sources
EPA Power Profiler supplies a geographic starting point. EPA’s electric vehicle environmental explainer covers tailpipe versus electricity impacts. The federal FuelEconomy.gov Beyond Tailpipe Emissions tool supports vehicle and emissions comparisons when available.
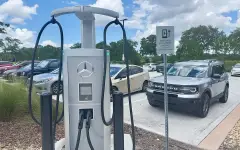
Photo: Solar-canopy electric vehicle charging location photographed in Canada; it is a real example of solar-associated charging, not an image of a U.S. ZIP code or EPA measured emissions. Raysonho / Wikimedia Commons, CC0 1.0.
Sık Sorulan Sorular
Can ZIP code tell me the exact CO2 emissions from my EV charger?
No. It can identify a relevant regional electricity mix or average for comparison, but precise charging emissions depend on actual consumed energy, when charging occurred and more granular grid conditions.
Does a solar canopy make every EV charging session zero-carbon?
Not necessarily. Solar electricity has lifecycle impacts and a charger may draw from the grid when on-site output is insufficient. The photo is illustrative, not a measurement of local grid emissions.