Quick answer: On a topographic map, contour lines connect places at the same elevation. Lines packed closely together usually indicate steep terrain. Lines that are far apart usually indicate a gentler slope. The contour interval—printed on the map—tells you the vertical distance between adjacent lines. To read your elevation, identify a labeled index contour and count up or down by that interval.
This U.S. geography lesson uses the U.S. Geological Survey’s (USGS) definitions to explain contour spacing, ridges, valleys, map scales and distance calculations. It includes examples designed for middle-school students, high-school students and beginners learning to interpret terrain. The diagrams implied by the exercises are hypothetical; they are not measurements from a particular hiking location.
What is a topographic map and why are contour lines important?
A topographic map shows the Earth’s landform shapes as well as features such as roads, waterways, boundaries and place names. The characteristic feature is an elevation contour: a line connecting points at equal height relative to the map’s specified reference surface or vertical datum. The USGS notes that contour lines reveal the height and shape of mountains and the steepness of slopes. See USGS: What is a topographic map? for the agency’s explanation.
The lines are not painted onto the landscape. Instead, they are a way of representing three-dimensional terrain on a flat page. A hiker, surveyor or student can use them to infer where the land rises, falls or forms a valley.
How to read contour spacing: steep versus gentle slopes
| What you see | What it usually means | Why |
|---|---|---|
| Contour lines close together | Steep slope | A larger elevation change occurs across a short map distance |
| Contour lines far apart | Gentle slope or relatively level ground | The same elevation change takes more horizontal distance |
| Nested closed loops with higher values inside | Hill or summit area | Elevation increases toward the center |
| Closed loops marked with inward hachures | Depression | The ticks indicate a lowered center |
| V-shaped bends crossing a stream | Often a valley | The V commonly points upstream |
These are rules of thumb for reading contour maps. You should confirm elevation labels, the legend and other features before making a navigation decision. A dark line on a map does not automatically mean a road: in USGS symbology, brown is commonly used for contours and blue for hydrographic features such as streams, but map editions and special maps may use different conventions.
What is the contour interval?
The contour interval is the elevation difference between neighboring contour lines. It is stated in the map margin or legend. The horizontal distance between the lines changes according to the slope; the vertical change is set by the interval for that map.
Worked example: a 20-foot contour interval
Imagine an index contour labeled 500 feet and the next higher index contour labeled 600 feet. If the interval is 20 feet, the contour elevations between them are 520, 540, 560 and 580 feet, followed by the 600-foot index contour. You can count the difference: 600 − 500 = 100 feet, and 100 ÷ 20 = five contour steps.
Common error: The 20-foot contour interval does not mean that the horizontal lines are 20 feet apart on the ground. It measures vertical elevation difference.
What is an index contour?
An index contour is usually printed as a heavier line and labeled with an elevation value to help readers determine the heights of surrounding, thinner intermediate contours. USGS map standards describe heavy brown index contours and thinner lines between them. Some maps show supplementary lines or special symbols; the exact conventions are in the USGS cartographic map-symbol guide.
How can you recognize hills, valleys and ridges?
Hills and summits
A group of closed, roughly concentric contours can indicate a hill if their labeled elevations increase toward the middle. For example, nested loops of 800, 820, 840 and 860 feet represent rising terrain toward the center. The highest enclosed contour does not give an exact summit elevation unless a benchmark or spot elevation is shown.
Valleys and streams
Where contours cross a valley, they often form a V pointing upstream, toward higher elevation. Trace any blue stream line and use the nearby contour values to distinguish upstream from downstream. This is especially useful when a valley is hard to recognize from a small map image.
Ridges
Contours can form broad U or V shapes along a spur or ridge. Reading surrounding elevations and nearby valleys helps distinguish a ridge from a drainage. A single V shape by itself is not sufficient evidence of water flow direction.
How to calculate distance on a USGS 1:24,000 map
A map scale of 1:24,000 is a ratio of map length to corresponding horizontal ground length using the same units. For example:
- 1 inch on the map × 24,000 = 24,000 inches on the ground = 2,000 feet (about 0.38 mile).
- 1 centimeter on the map × 24,000 = 24,000 centimeters on the ground = 240 meters.
- 2.5 inches on the map × 2,000 feet/inch = 5,000 feet (about 0.95 mile).
That last calculation measures horizontal distance on the map, not automatically the distance someone walks. A winding trail and a steep slope may make travel longer. Current USGS US Topo maps commonly use 1:24,000 scale; older historical maps were published at various scales. Always read the scale on the exact map you are using. Source: USGS topographic map overview.
How to estimate slope from contours
Slope as a percentage can be estimated using vertical rise ÷ horizontal run × 100. Suppose the mapped terrain gains 100 feet of elevation over 1,000 feet of horizontal distance. The approximate grade is 100 ÷ 1,000 × 100 = 10%. This does not mean the trail is uniformly 10% steep at every step; it is an average over the chosen stretch. Read the elevations and scale using the map’s reference system, and do not mix feet and meters in the same calculation.
Where can you find official U.S. topographic maps?
- Start with the USGS overview of topographic maps to identify US Topo, OnDemand Topos and historical maps.
- Use the official USGS topoView map browser to explore historical quadrangle maps.
- Find the map’s scale, contour interval, elevation units and vertical datum in the map margin or legend before reading elevations.
- Check the map’s publication date. Historical maps can illustrate landforms but may not show current roads, conditions or trails.
- For outdoor trips, supplement topographic reading with current park alerts and approved navigation resources. A topo sheet does not report today’s trail closures, hazards or weather.
Common map-reading mistakes
- Confusing elevation between contours with the distance between lines.
- Assuming a contour interval of 20 feet means every map uses feet instead of meters.
- Using a 1:24,000 scale formula on a map printed or resized at a different effective scale.
- Assuming the top of a hill always equals the elevation of the highest closed contour.
- Treating an old topographic map as a current hiking or road map.
Topographic map practice quiz with answers
1. What do contour lines connect?
Answer: Points with equal elevation on the mapped land surface.
2. Two areas have the same contour interval. Which is steeper: one with close lines or one with wide gaps?
Answer: Generally the one with closer lines.
3. With a 10-meter interval, what is the next uphill contour after 250 meters?
Answer: 260 meters.
4. A 1:24,000-scale map shows two places 3 centimeters apart. What is the straight-line horizontal ground distance?
Answer: 3 × 240 = 720 meters.
5. An index contour is labeled 900 feet. The next contour uphill has a 40-foot interval. What is its elevation?
Answer: 940 feet.
6. What direction does a stream-valley contour V typically point?
Answer: Upstream, toward higher elevation, although always check the surrounding contour labels.
Related geography lessons and primary sources
To build map-coordinate skills, study Latitude vs. Longitude: Coordinates and Hemispheres. Learn how landforms relate to geology in The Rock Cycle Explained and browse Geography & Map Skills.
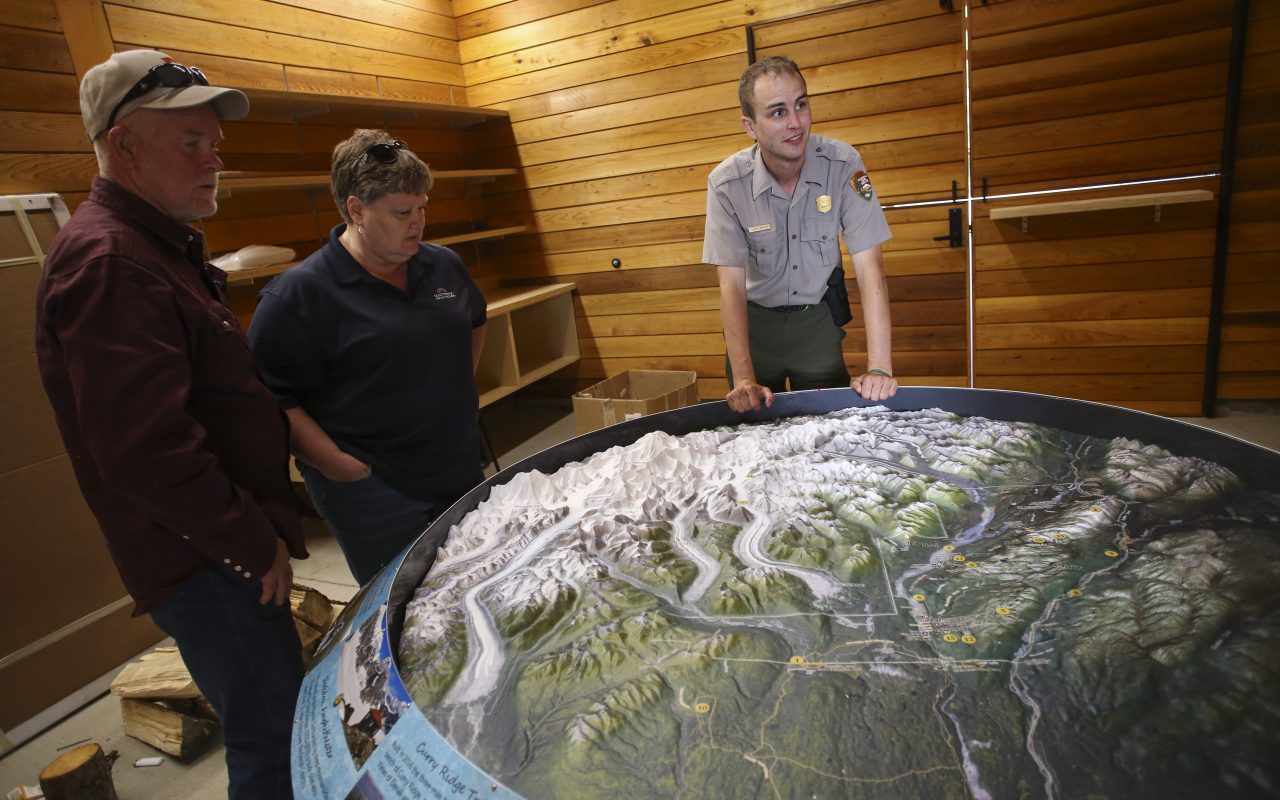
Official sources: USGS — What is a topographic map?; USGS — Map Symbol Guide; USGS topoView. Real photograph: NPS Photo / Emily Mesner, public domain. It depicts a park ranger explaining Denali climbing routes using a physical relief map in July 2017, not the hypothetical topographic map in our exercises.
Sık Sorulan Sorular
What do contour lines mean on a topographic map?
Each line connects points at the same elevation. Their shape and spacing help show hills, valleys and slopes.
What do close contour lines mean?
They generally mean a steep slope: elevation changes rapidly over a short horizontal distance.
How do you find elevation between two index contours?
Read the map's contour interval, count the intervening lines, and add or subtract the interval as you move uphill or downhill.
What does 1:24,000 scale mean?
One inch on the map represents 24,000 inches or 2,000 feet on the ground; one centimeter represents 240 meters.
Do topographic maps show actual trail length?
A paper map scale measures horizontal map distance. A winding route is longer than a straight line, and slope can increase the ground distance; trace the actual route and check current trail information.